Geospatial Research · 2025
Wildfire Hotspot Analysis in Peru
Spatial Patterns, Temporal Trends & Threats to Protected Areas
This study analyzes active fire hotspots and burned area data across Peru using NASA FIRMS, MODIS MCD64, and Sentinel-2 LULC, identifying high-risk clusters and their overlap with national protected areas and indigenous territories.
Interactive Fire Map
Toggle layers · Pan & zoom · Click points for details
Data: NASA FIRMS · SERNANP · MINAM · Base map: OpenFreeMap
Fire by Land Governance Type
Distribution of fire hotspots across land governance categories · All years (2000–2024)
Key finding
98.6% of detected fires burned in unprotected forest. 329 hotspots (1.0%) fell within national protected areas.
- Unprotected Forest31,925 · 98.6%
- National Protected Area329 · 1%
- Regional Conservation105 · 0.3%
- Private Conservation5 · 0%
Fire seasonality
Hotspots by month · All years (2000–2024) · Peak: August–September
Temporal Analysis
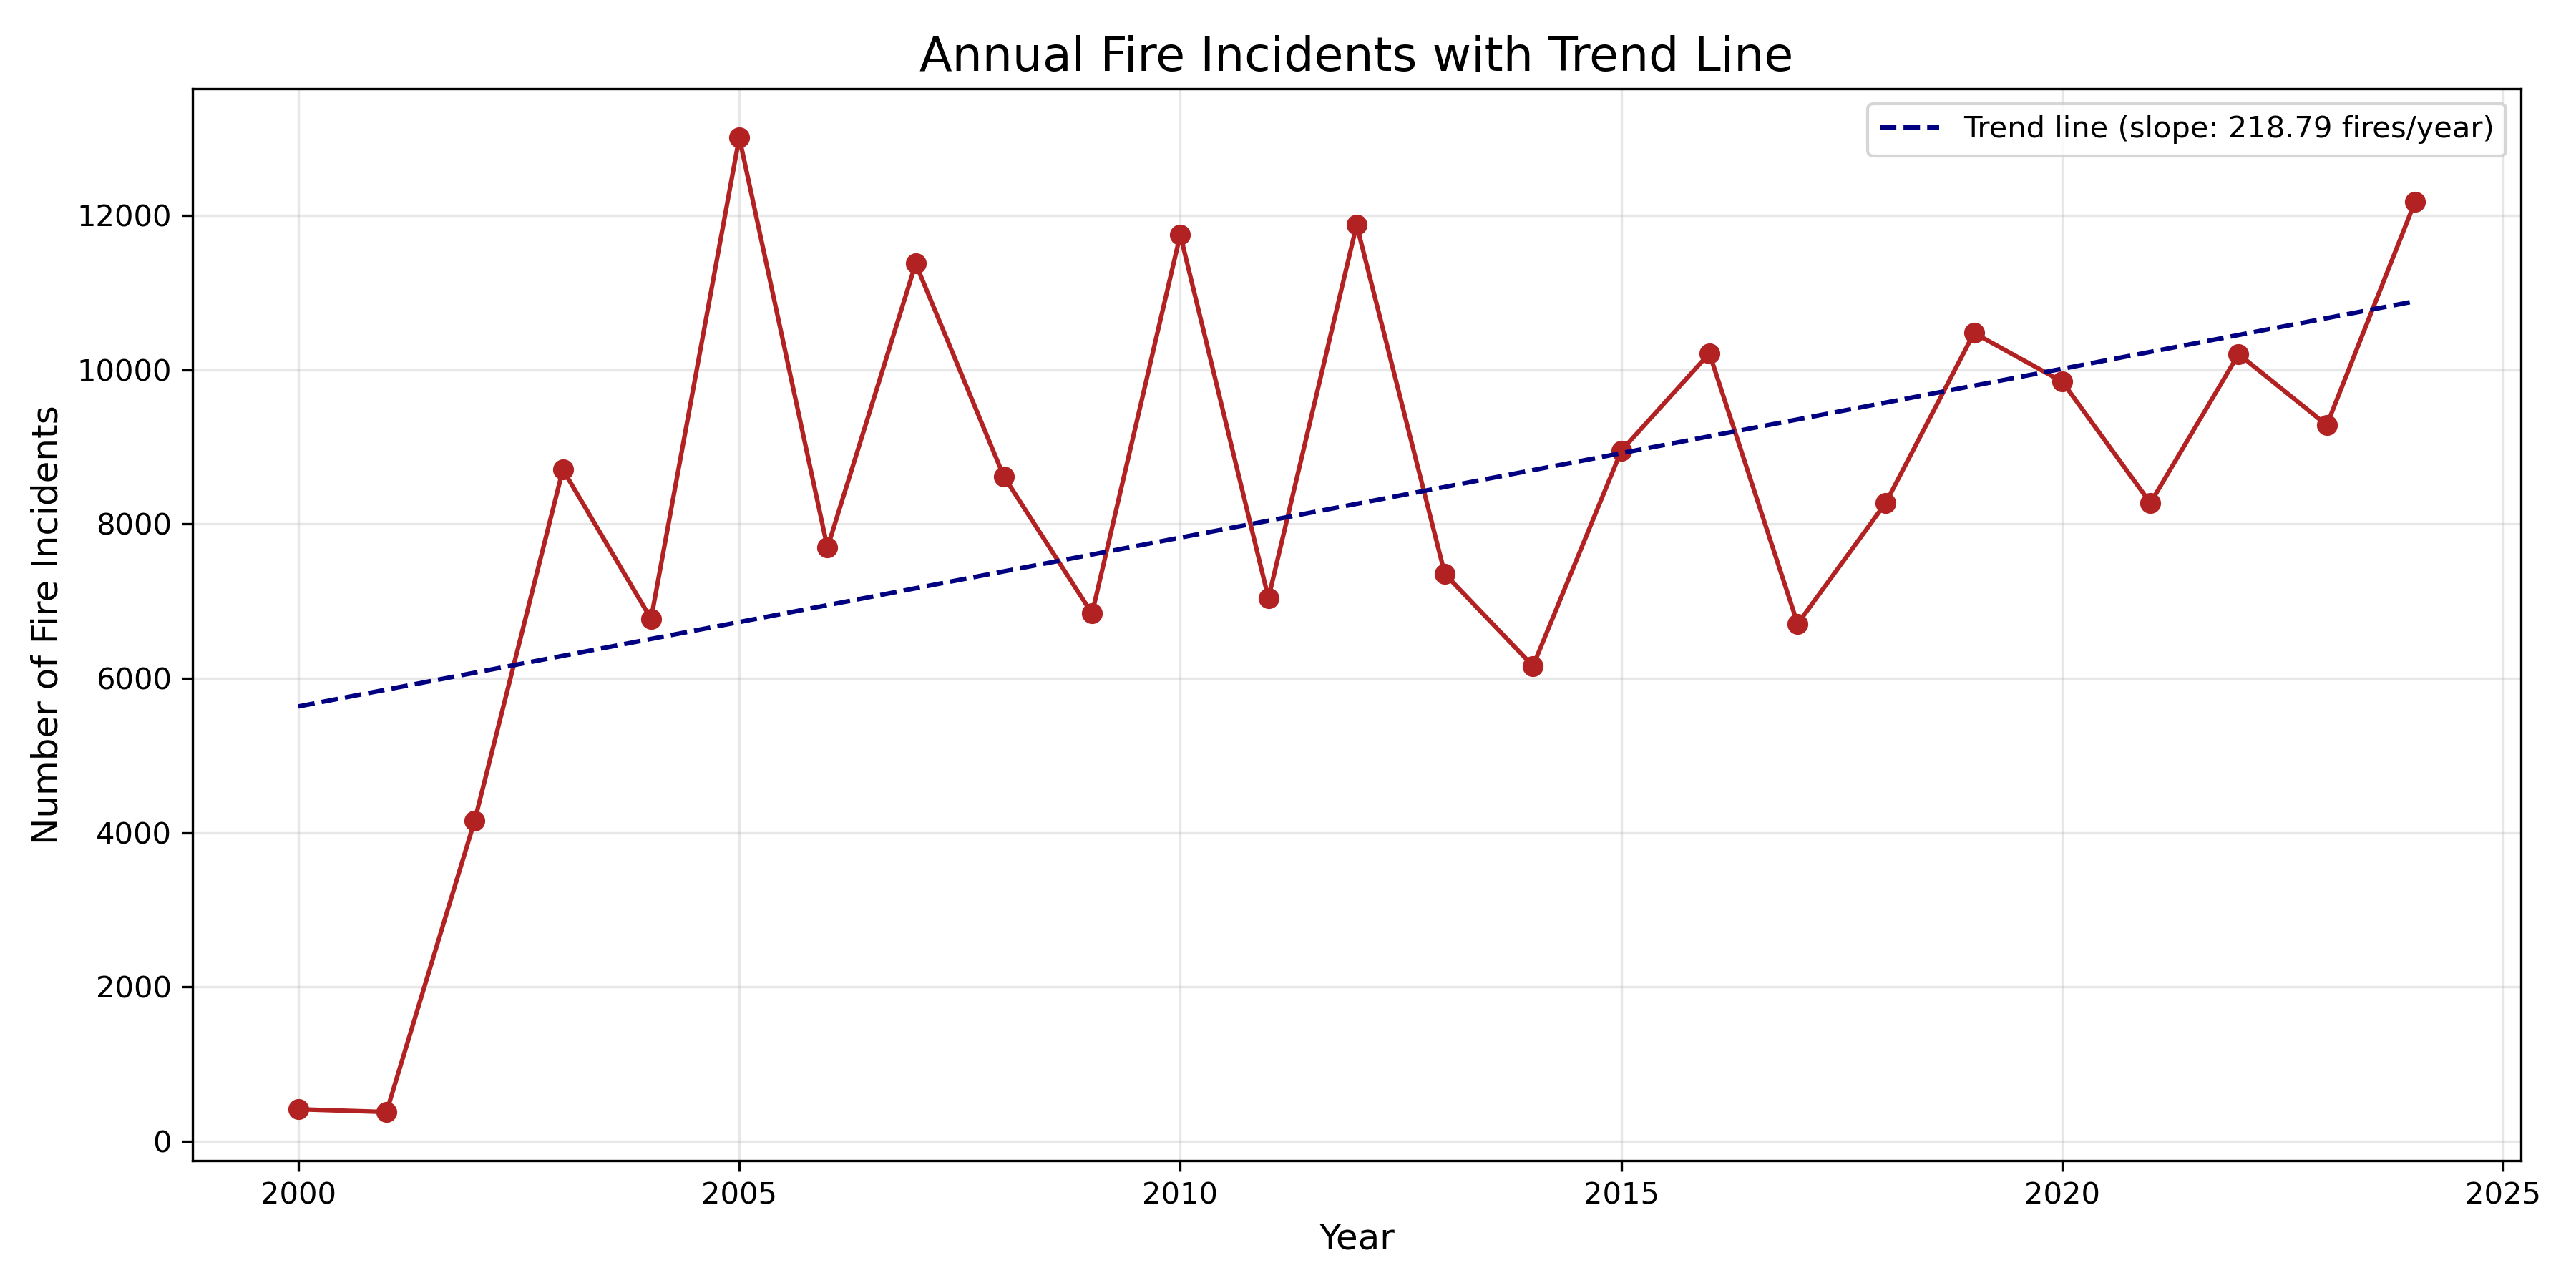
Annual Fire Trend
Total hotspots per year · NASA FIRMS
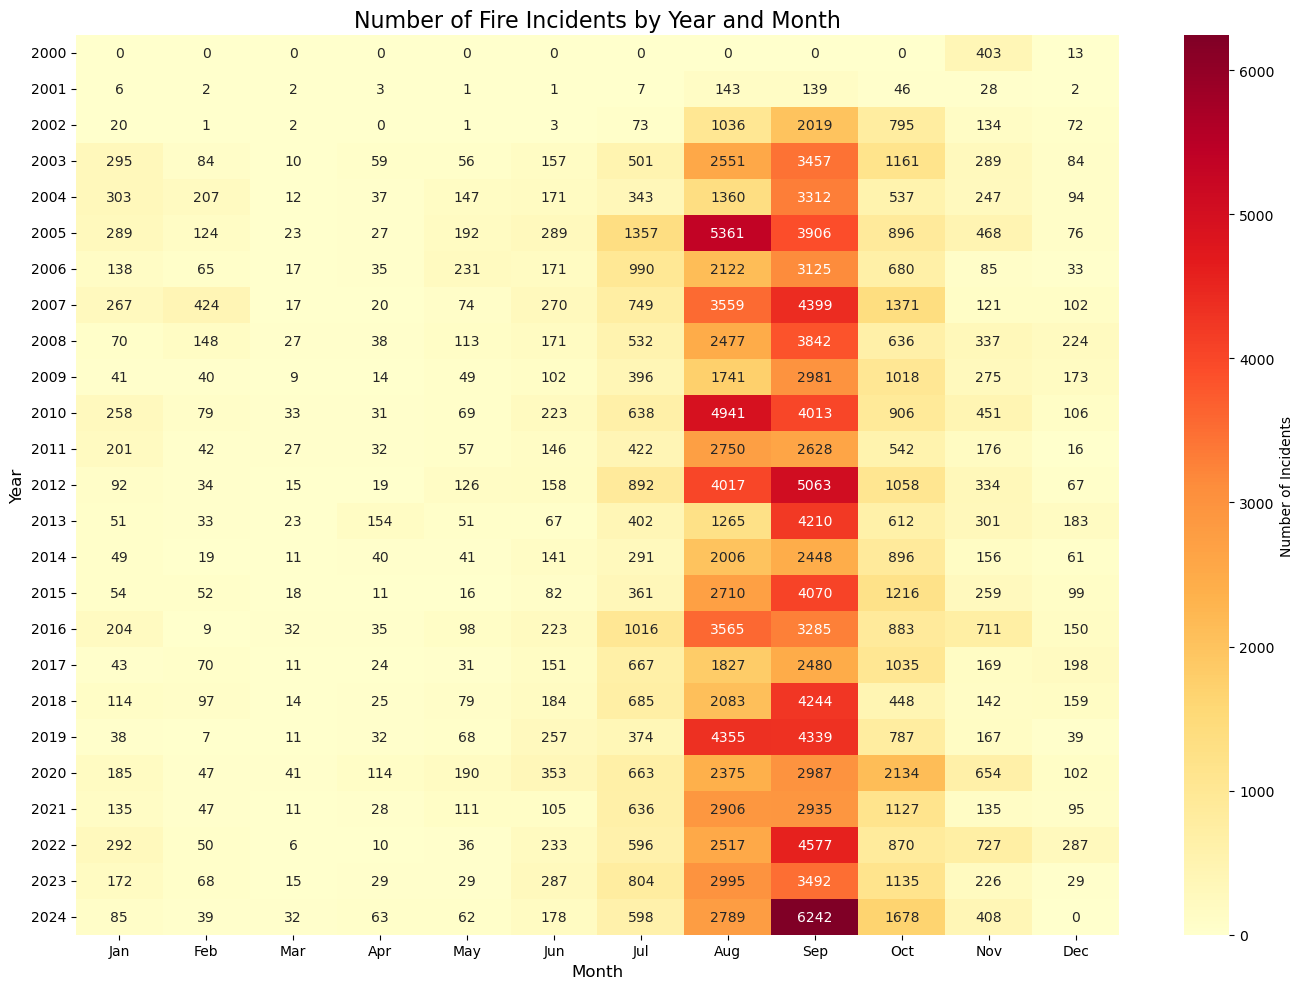
Year × Month Heatmap
Fire intensity by year and month · 2000–2024
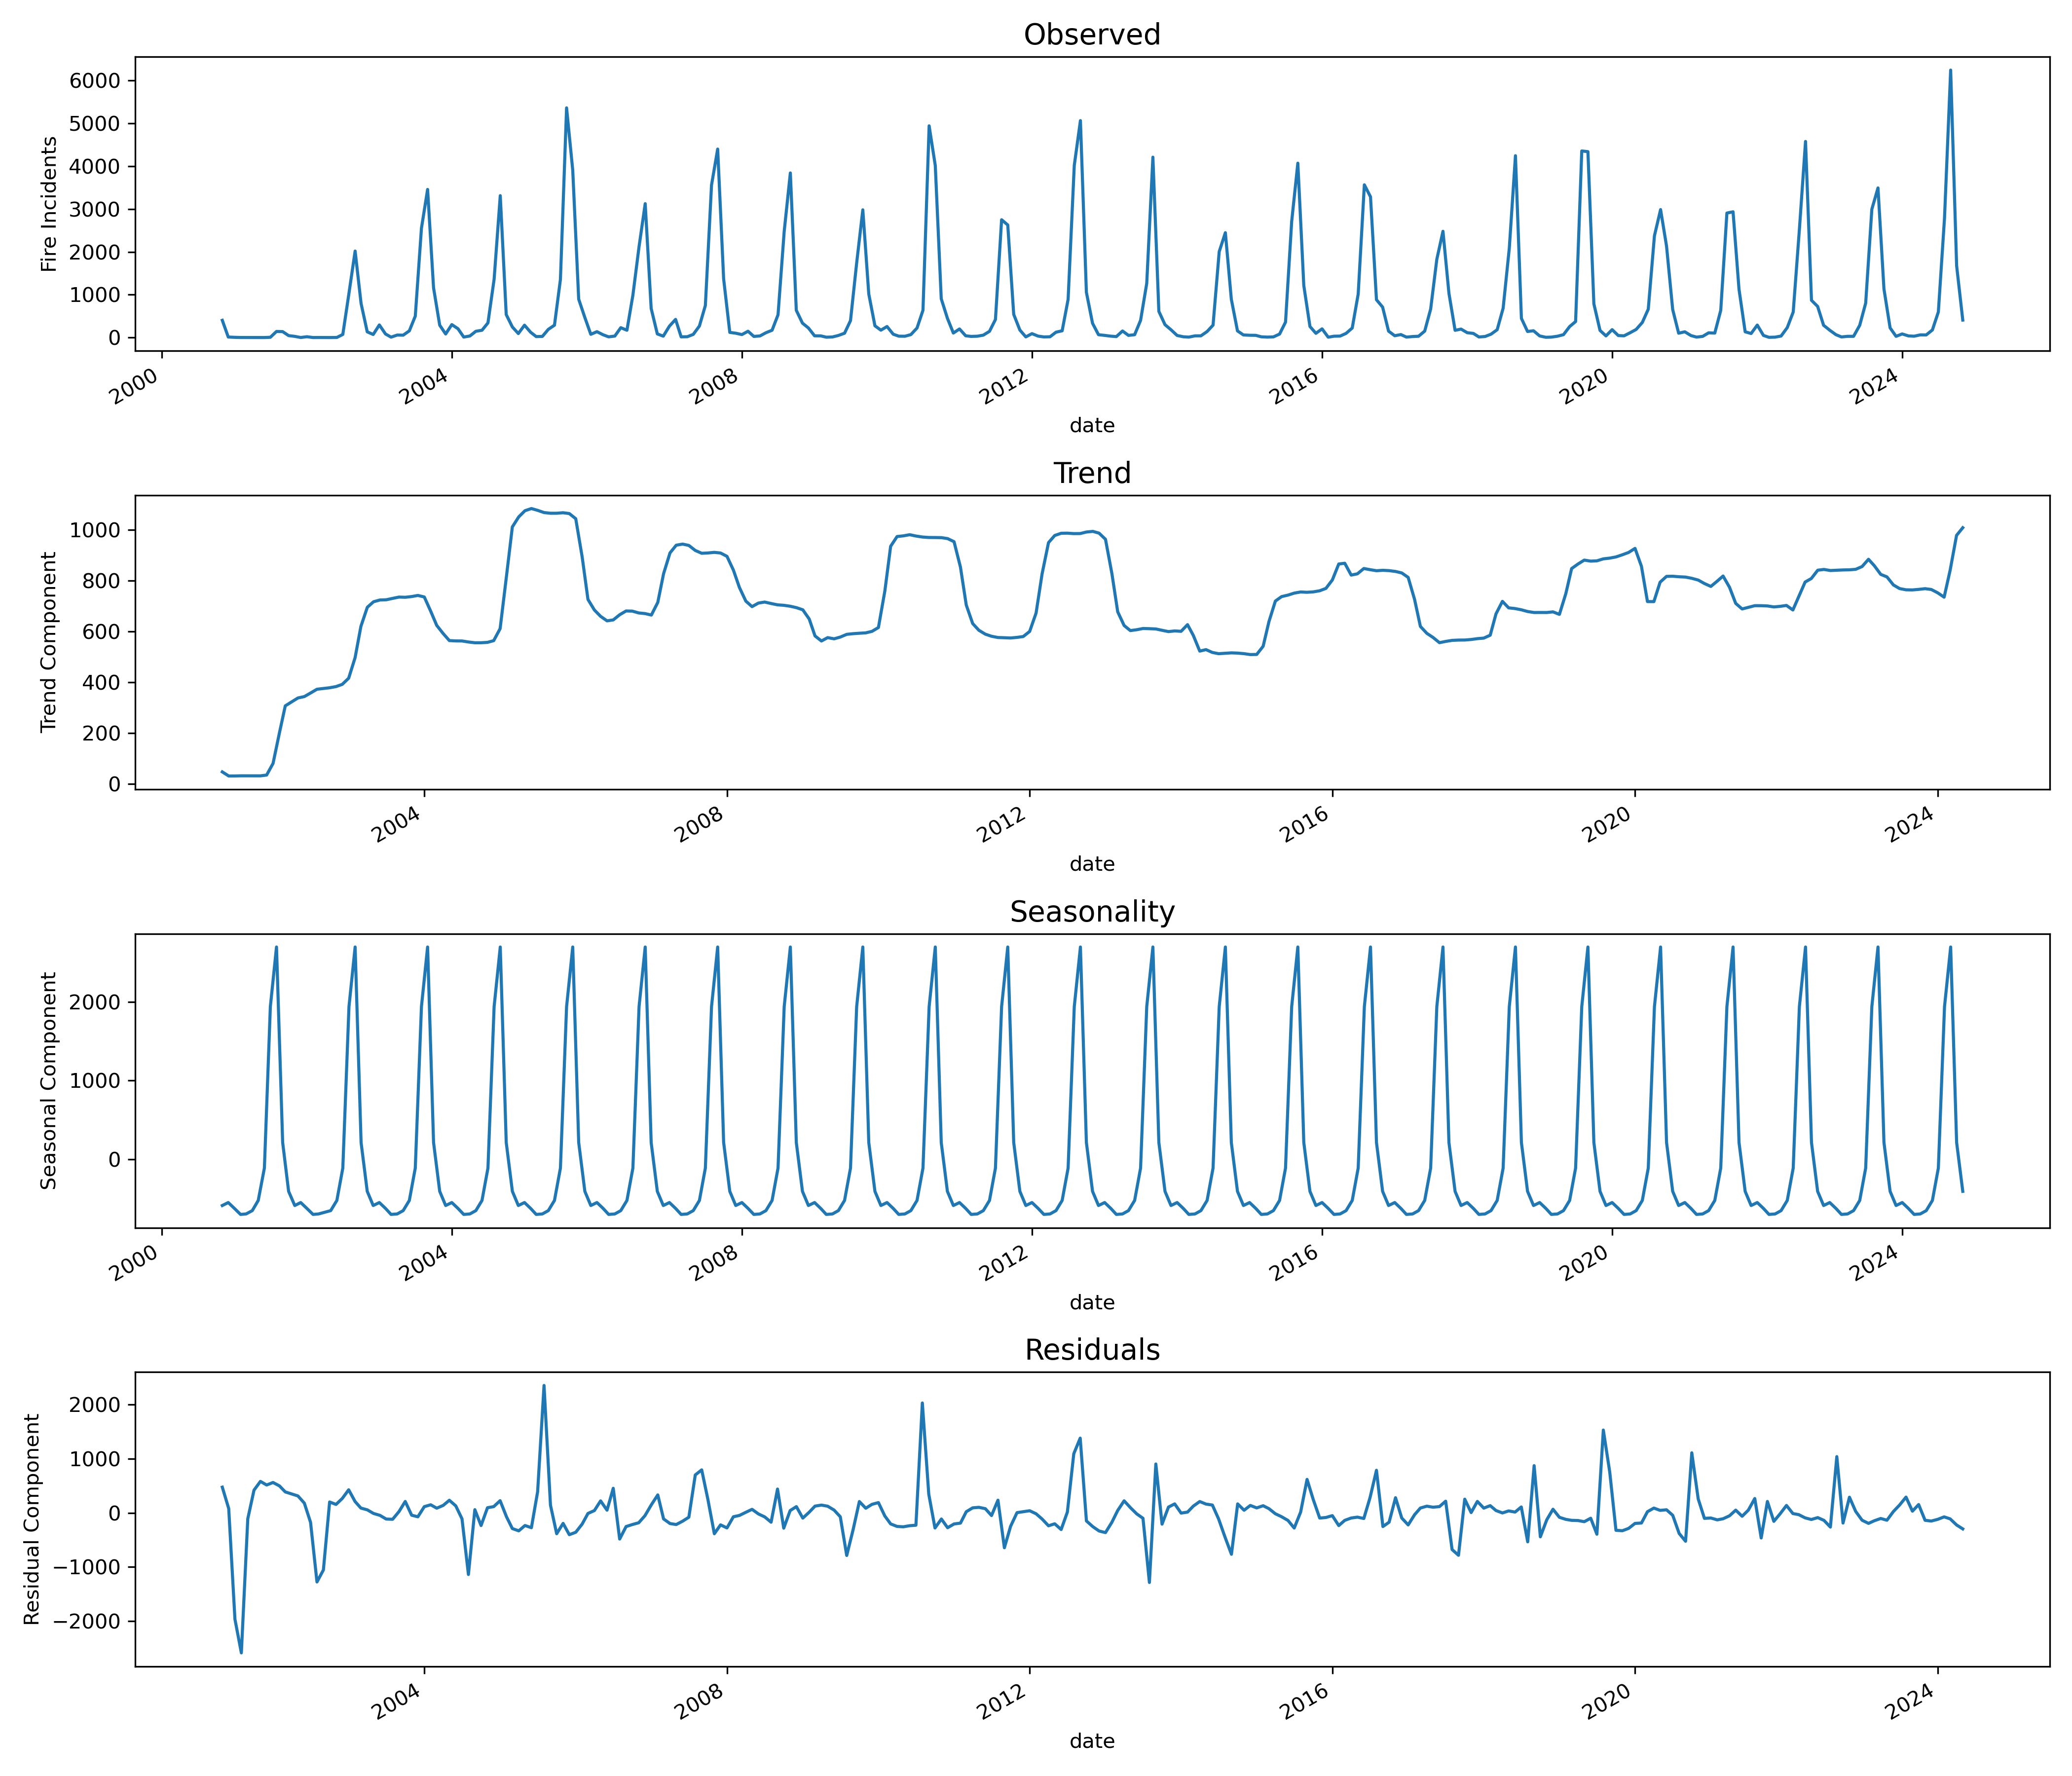
Seasonal Decomposition
STL trend · seasonal · residual components
Active Fire Hotspots vs Burned Area
Annual comparison 2001–2024 · Left axis: Fire Hotspots count · Right axis: Burned Areas polygon count
Regional Fire Ranking
Top 20 districts by hotspot count · All years (2000–2024)
| Rank | District | Hotspots | % of top 20 | Share |
|---|---|---|---|---|
| #1 | Puerto Inca | 4,390 | 15.2% | |
| #2 | Padre Abad | 3,857 | 13.4% | |
| #3 | Coronel Portillo | 3,461 | 12.0% | |
| #4 | Tambopata | 2,399 | 8.3% | |
| #5 | Bellavista | 1,988 | 6.9% | |
| #6 | Tahuamanu | 1,986 | 6.9% | |
| #7 | Mariscal Cáceres | 1,562 | 5.4% | |
| #8 | Oxapampa | 1,250 | 4.3% | |
| #9 | Satipo | 1,016 | 3.5% | |
| #10 | Ucayali | 842 | 2.9% | |
| #11 | Alto Amazonas | 842 | 2.9% | |
| #12 | La Convención | 763 | 2.7% | |
| #13 | Lamas | 657 | 2.3% | |
| #14 | Picota | 650 | 2.3% | |
| #15 | San Martín | 609 | 2.1% | |
| #16 | Huallaga | 607 | 2.1% | |
| #17 | Leoncio Prado | 569 | 2.0% | |
| #18 | Atalaya | 509 | 1.8% | |
| #19 | Tocache | 431 | 1.5% | |
| #20 | Marañón | 403 | 1.4% |
Methodology & Tools
Data Sources
- 🛰️ NASA FIRMS — J1V-C2, J2V-C2, SV-C2, M-C61
- 🌍 MODIS MCD64A1 Burned Area
- 🗺️ Sentinel-2 10m LULC 2024
- 🏛️ SERNANP National Protected Areas
- 🌱 MINAM Indigenous Community Boundaries
Analysis Pipeline
- 🐍 Python · GeoPandas · Pandas
- 📊 DBSCAN Spatial Clustering
- 📈 STL Temporal Decomposition
- 🗺️ QGIS · ArcGIS Pro
- 📁 R Markdown · Jupyter Notebooks